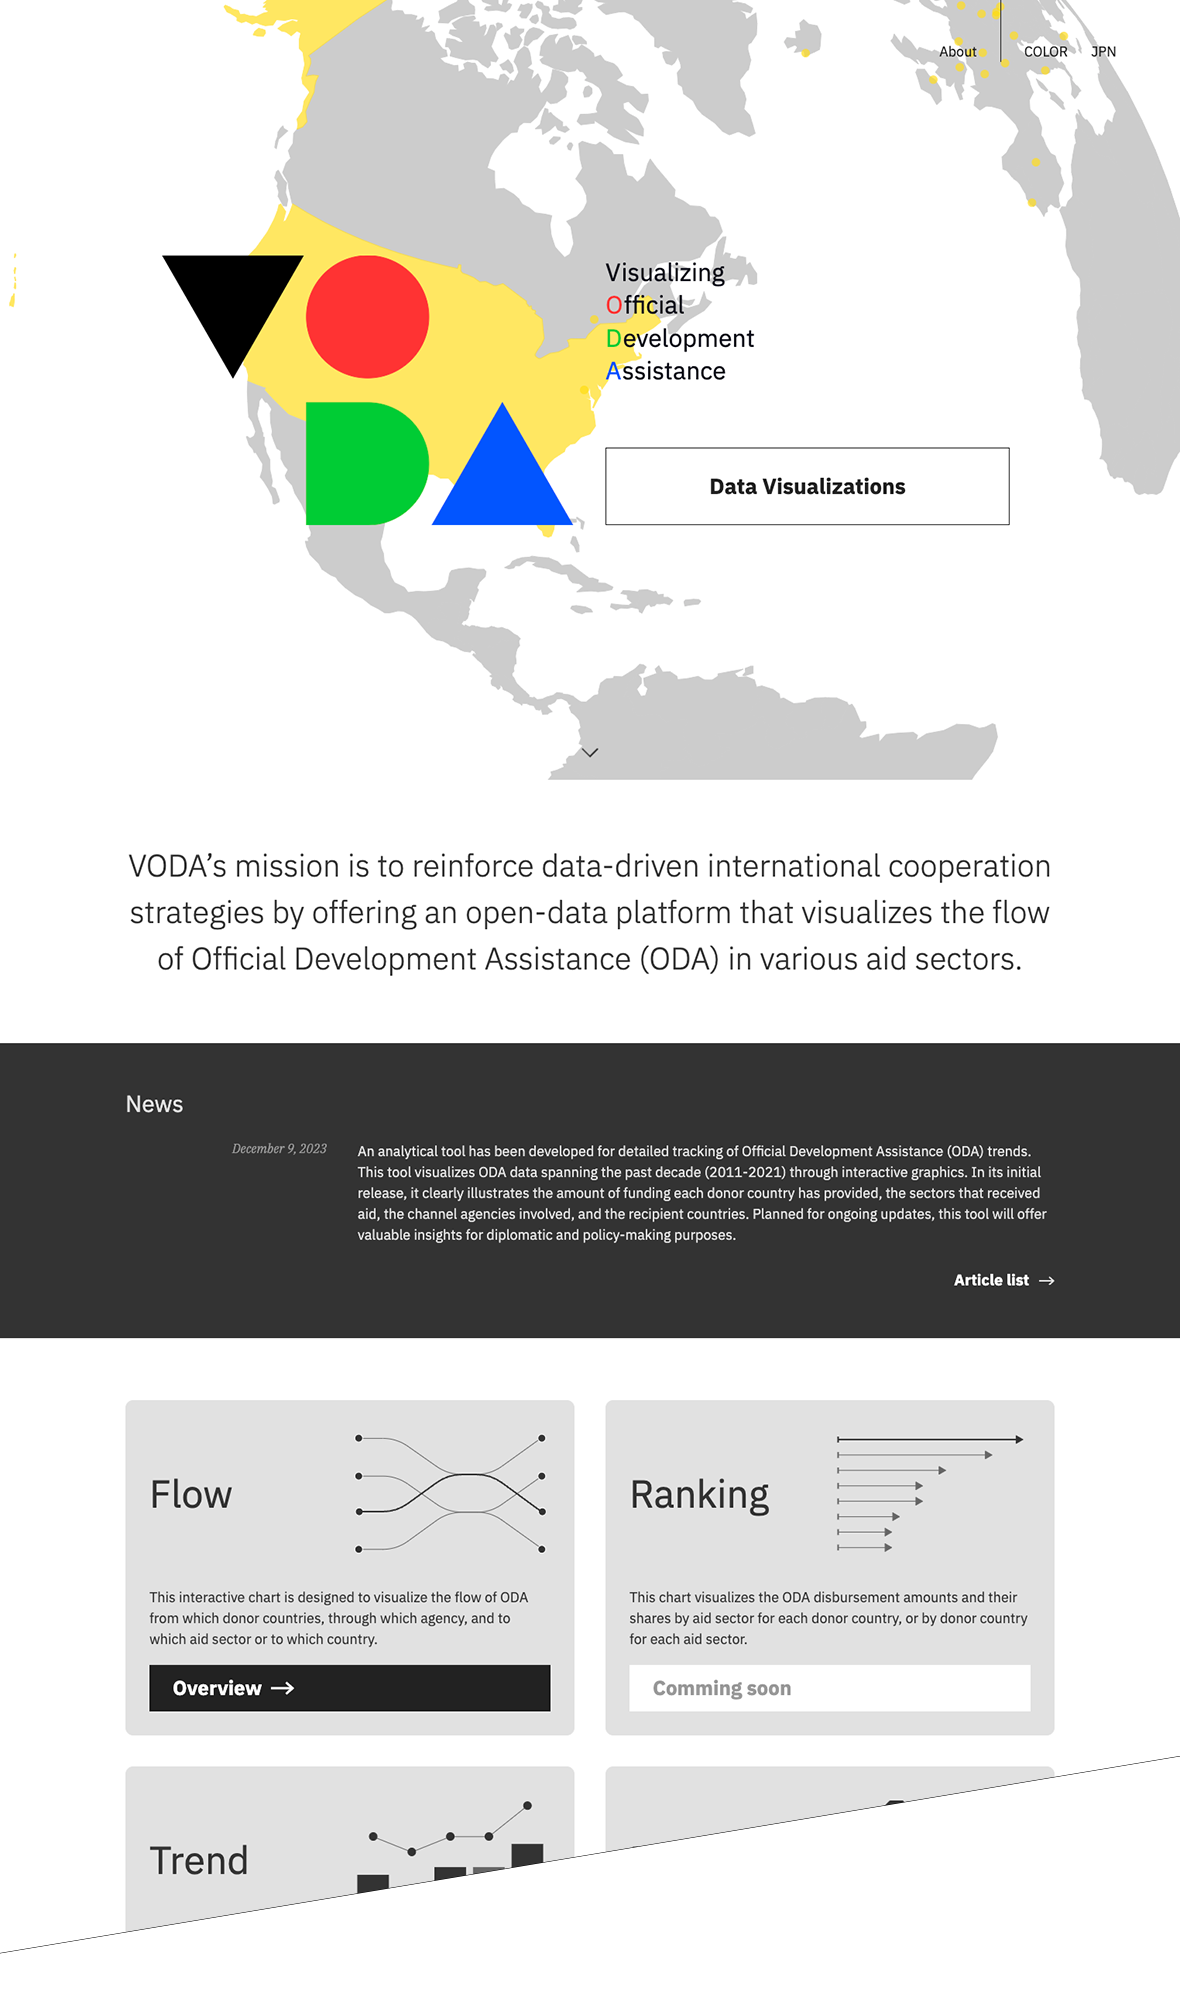
VODA – Visualizing Official Development Assistance
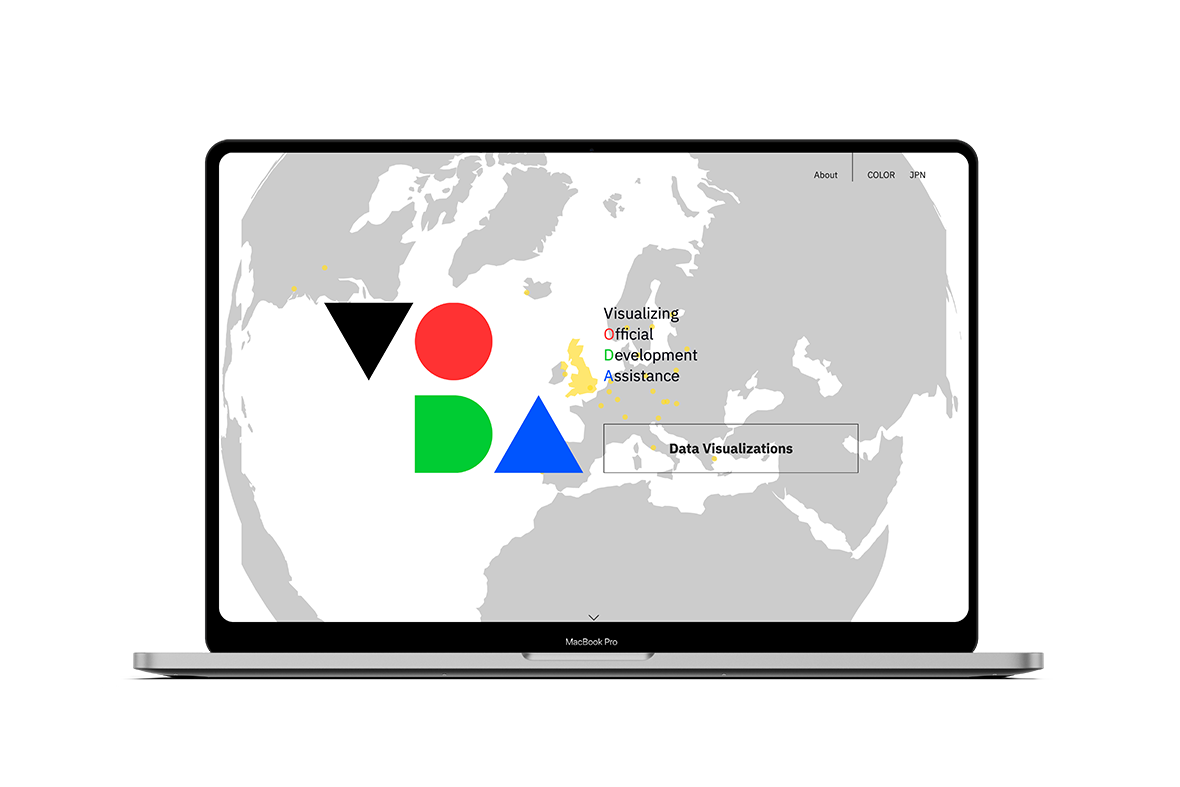
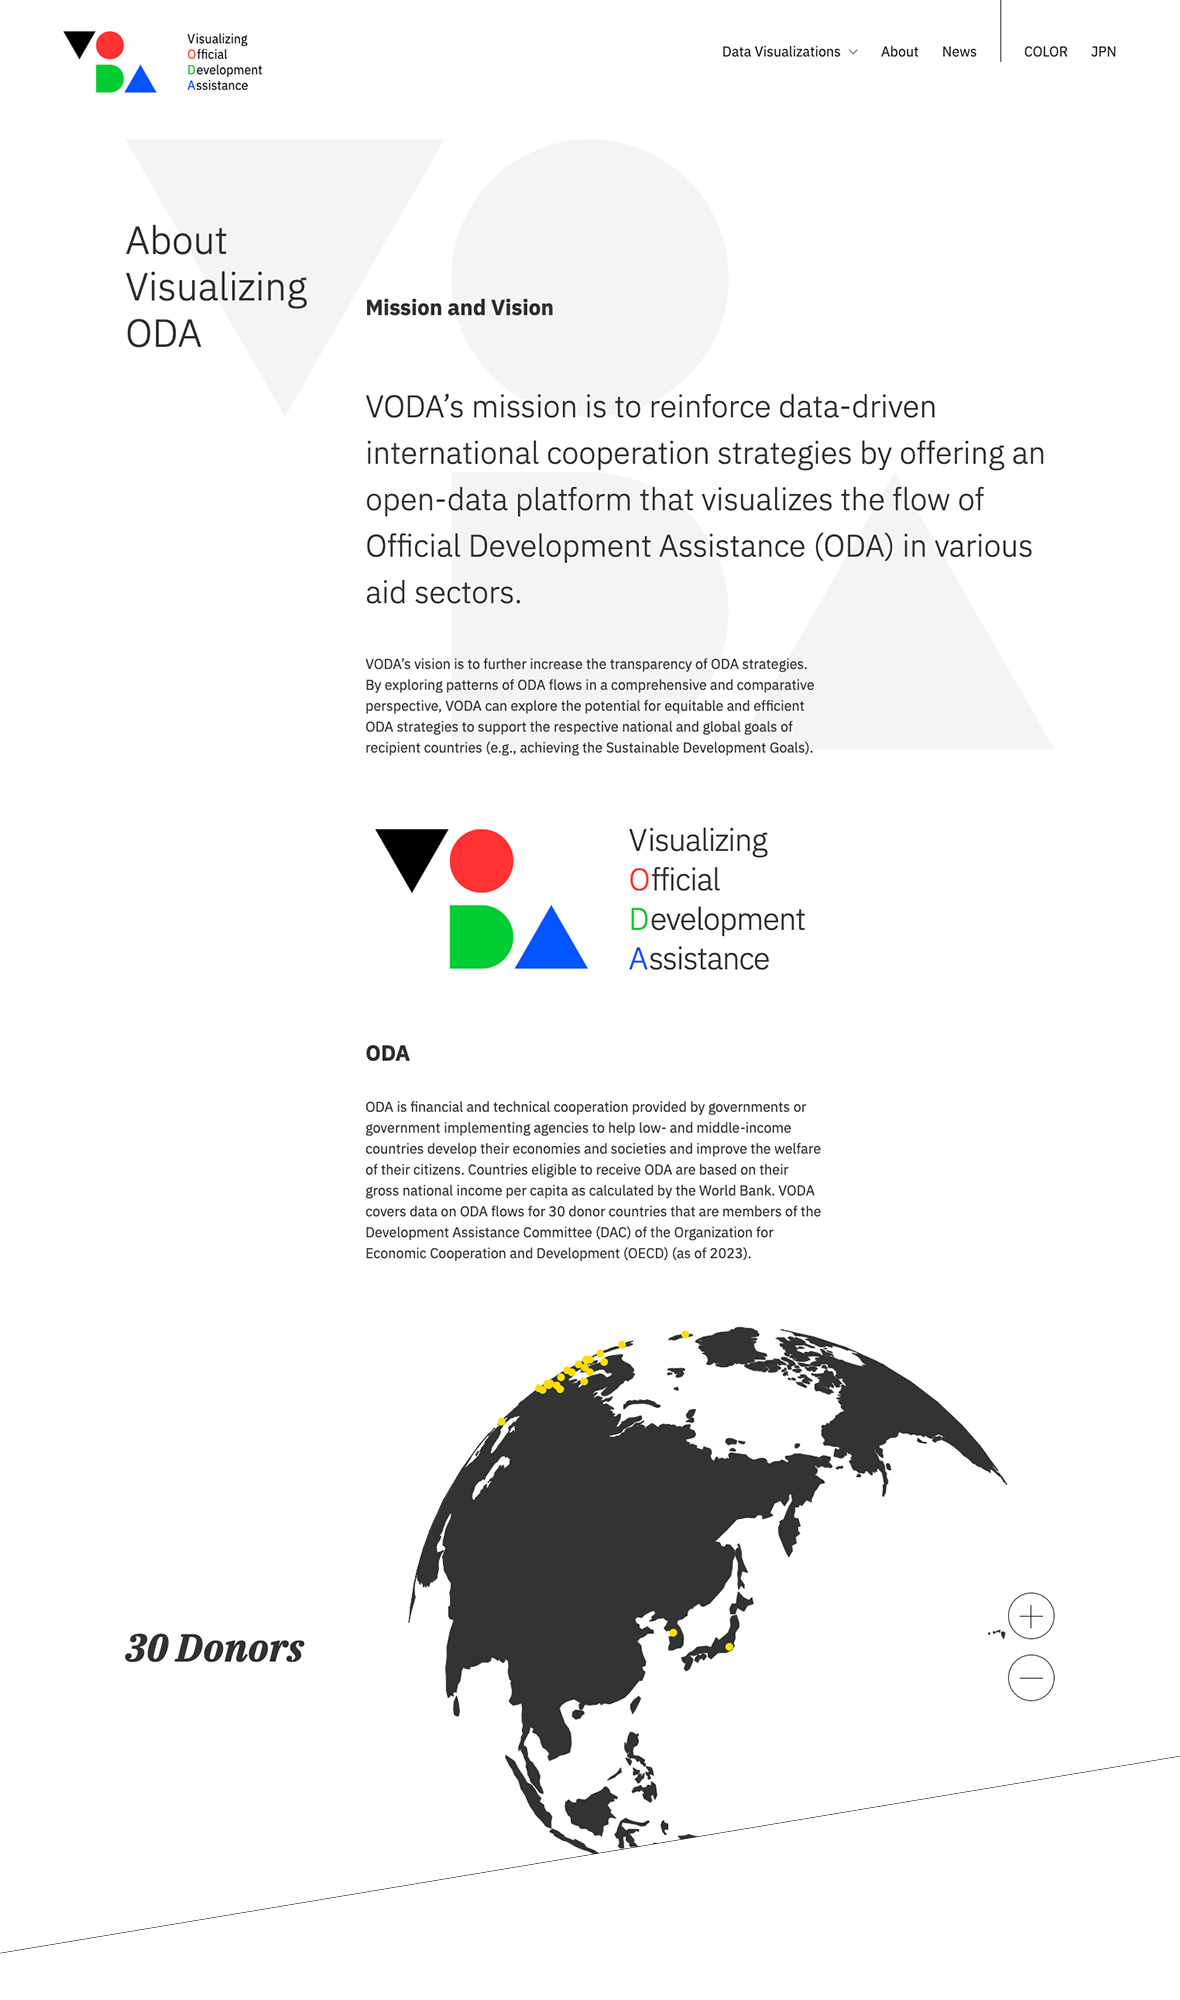
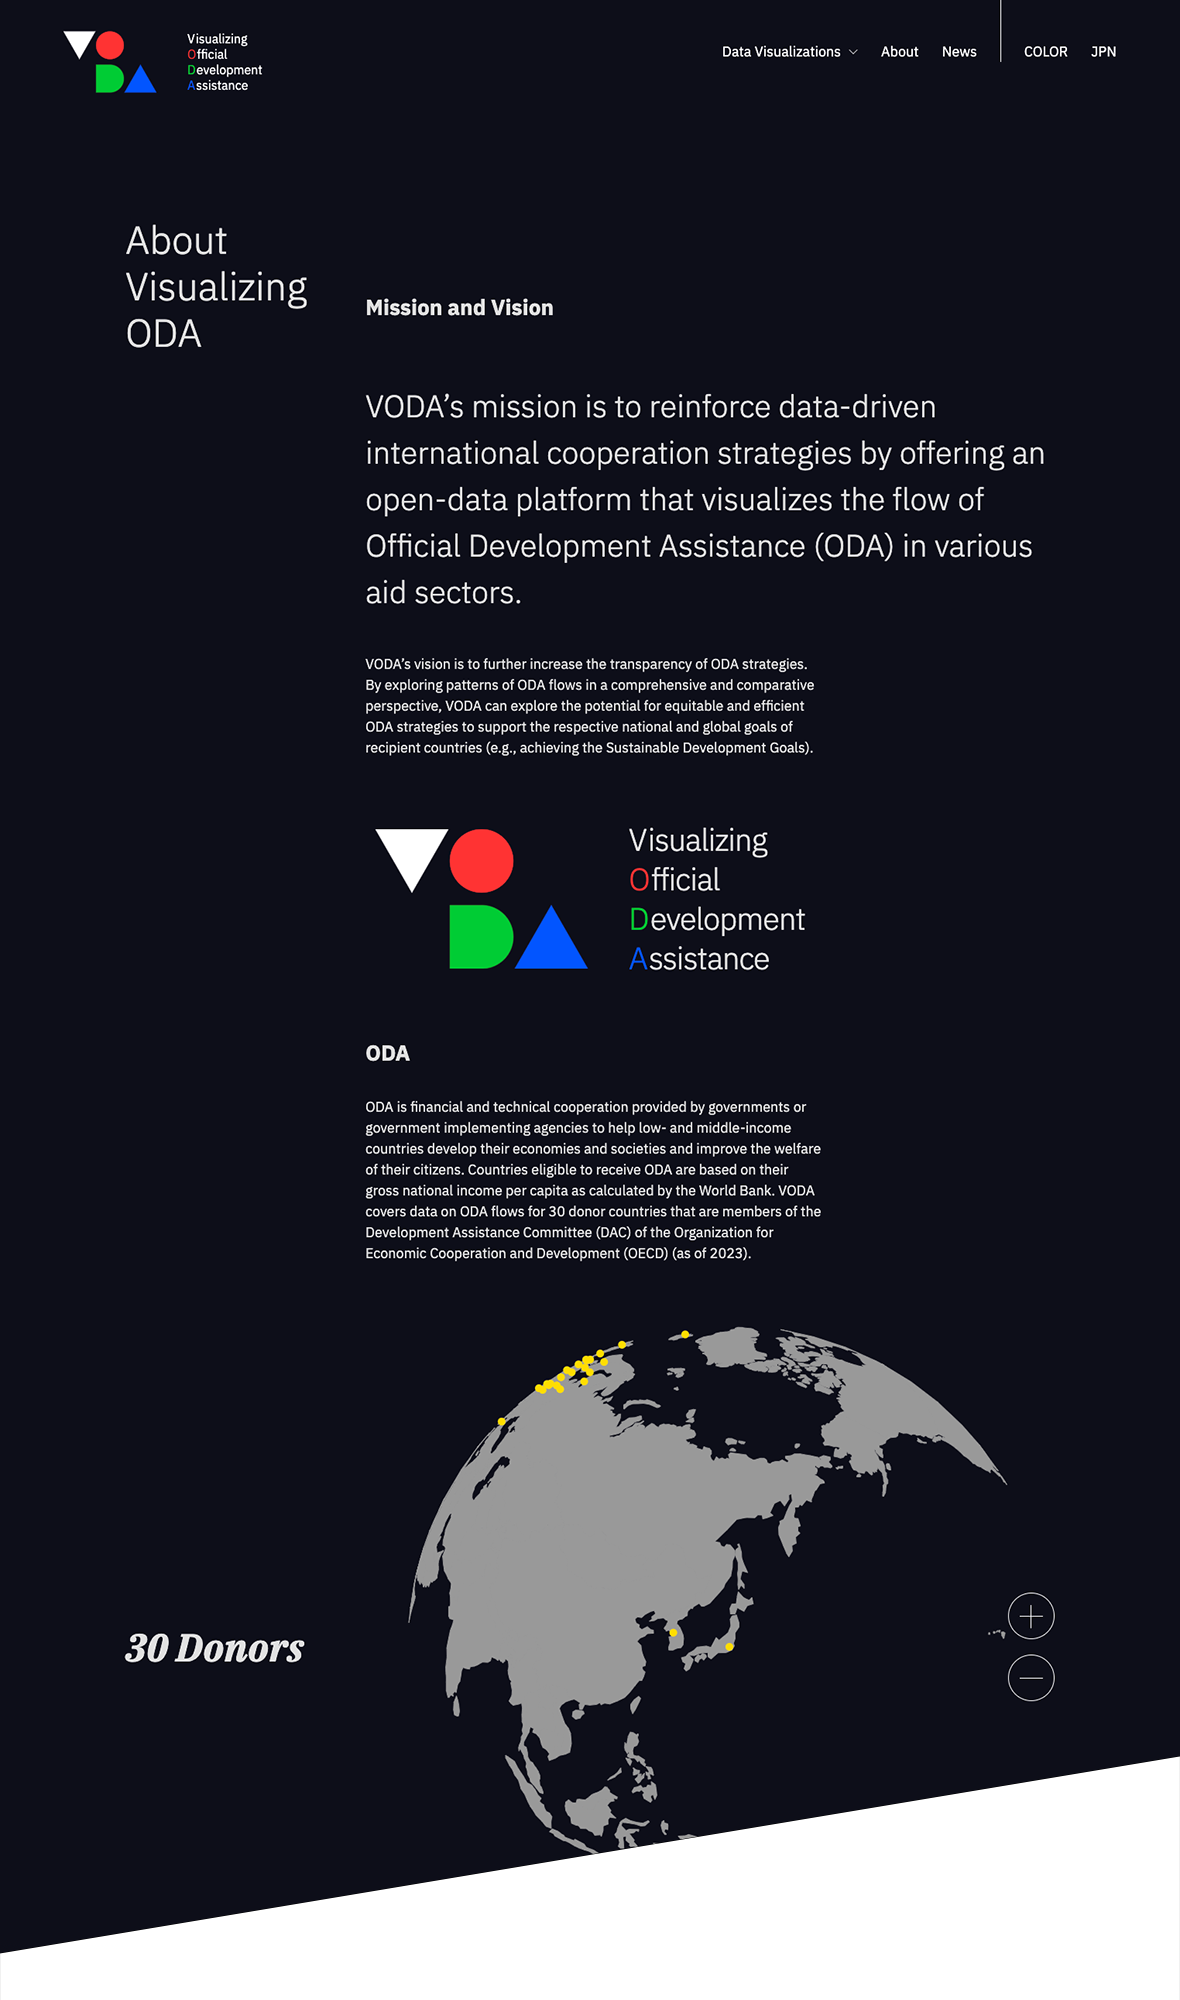
VODA’s mission is to reinforce data-driven international cooperation strategies by offering an open-data platform that visualizes the flow of Official Development Assistance (ODA) in various aid sectors.
VODA’s vision is to further increase the transparency of ODA strategies. By exploring patterns of ODA flows in a comprehensive and comparative perspective, VODA can explore the potential for equitable and efficient ODA strategies to support the respective national and global goals of recipient countries (e.g., achieving the Sustainable Development Goals).
VODA Visualizing Official Development Assistance https://visualizingoda.org/
Created by Shuhei Nomura Art Direction / Design : bowlgraphics Inc. Web / Program : yamani handicraft
Language : JPN/ENG Color : Light/Dark Mode Screen : 1280 × 1024px (SXGA) or higher
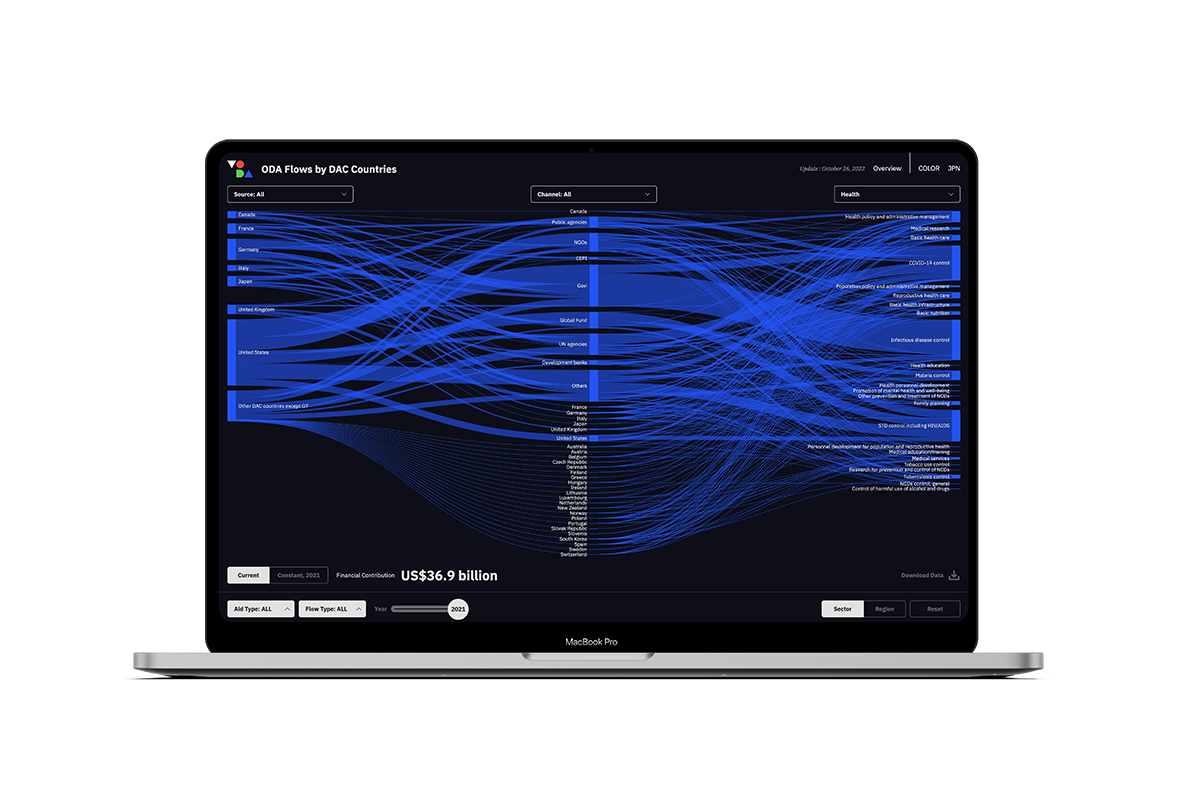
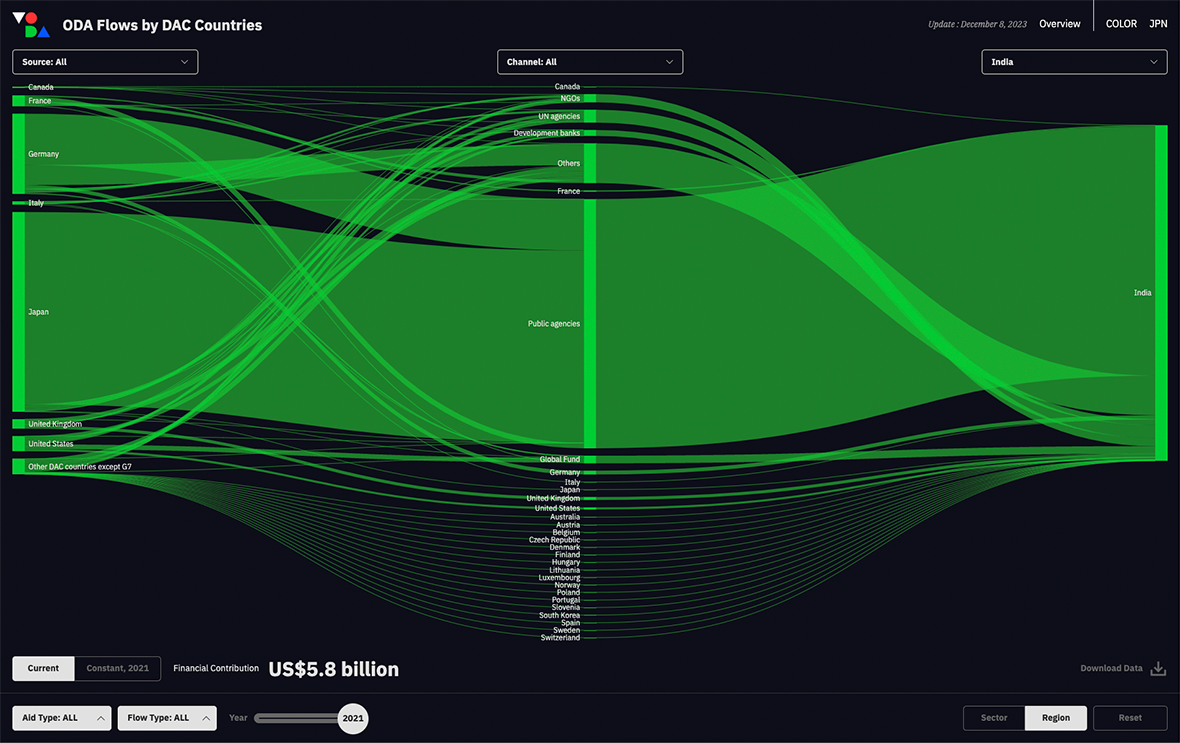
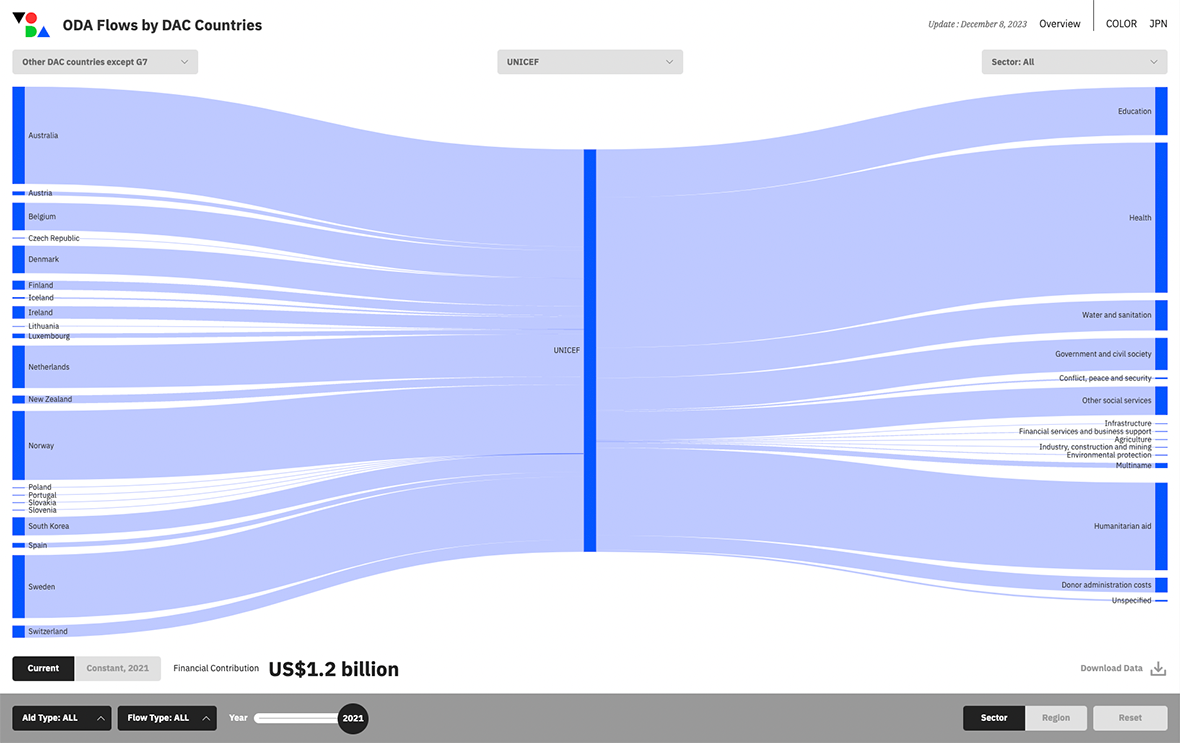
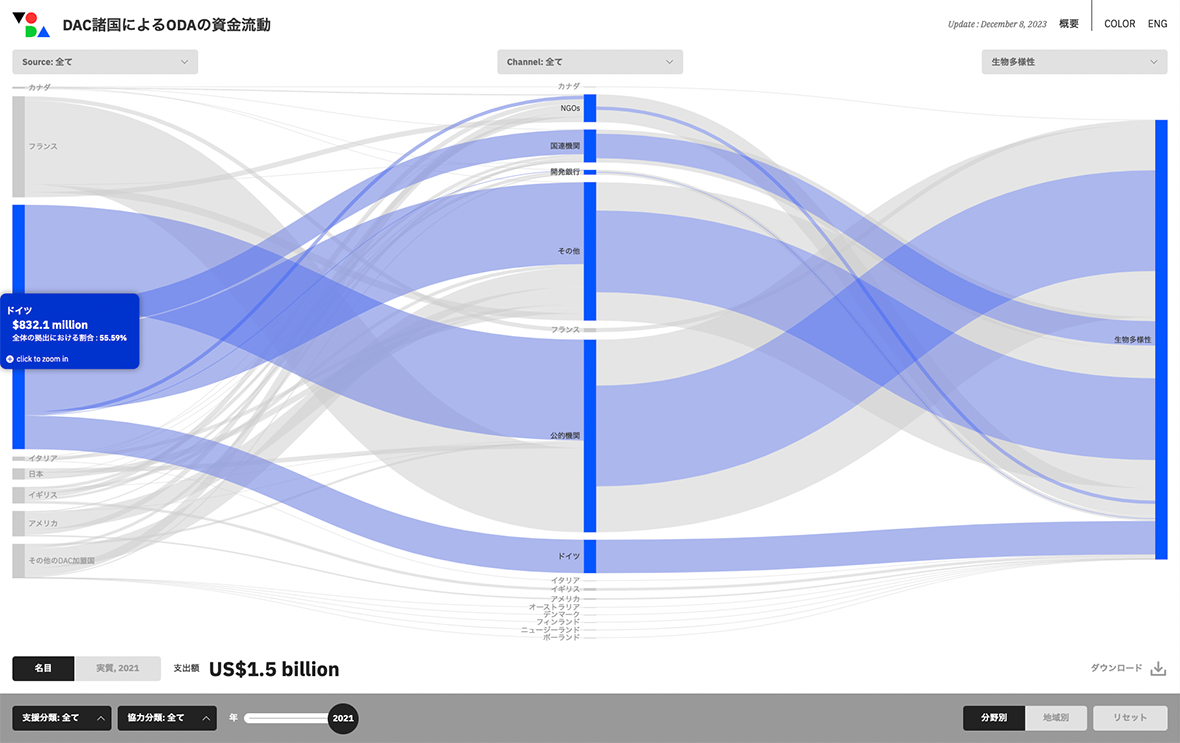
FLOW ODA Flows by DAC Countries https://visualizingoda.org/flow
This interactive chart is designed to visualize the flow of ODA from which donor countries (source), through which agency (channel), and to which aid sector or to which country (recipient). You can view flows by 22 aid sectors and switch tabs to view flows by recipient or focus area. Donor countries are listed in alphabetical order.
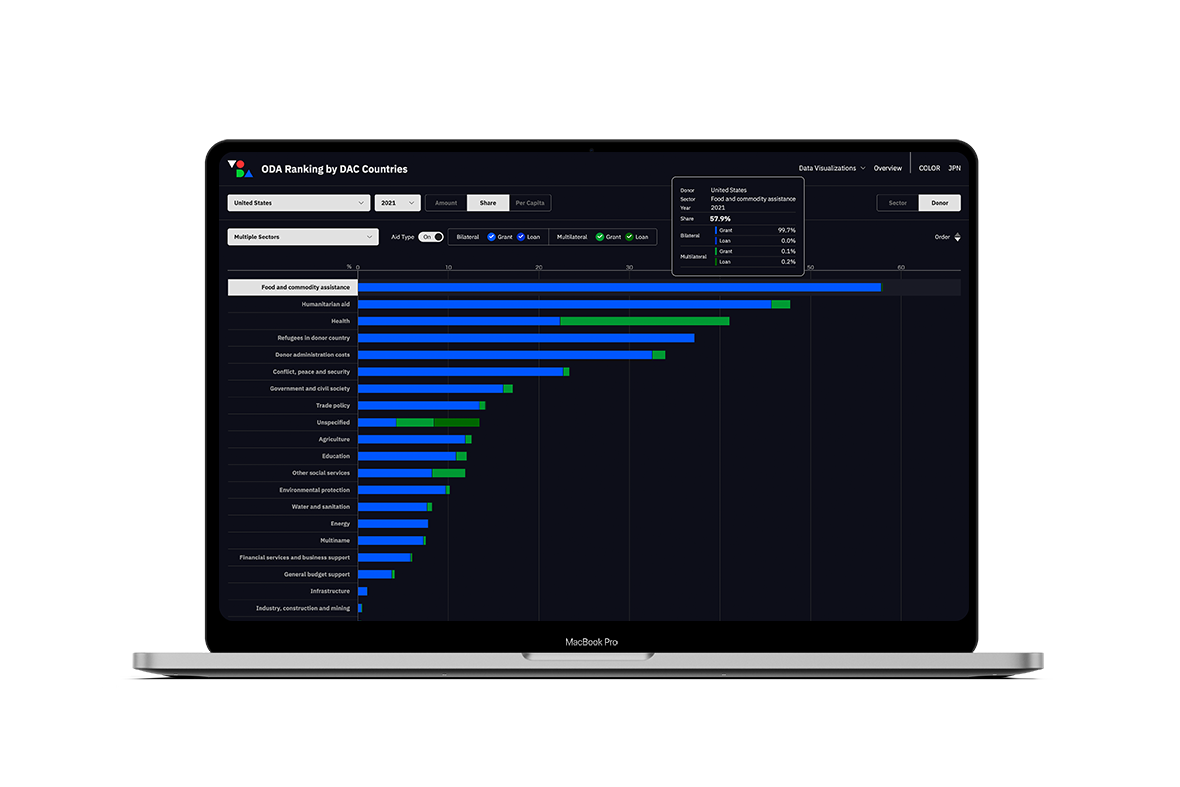
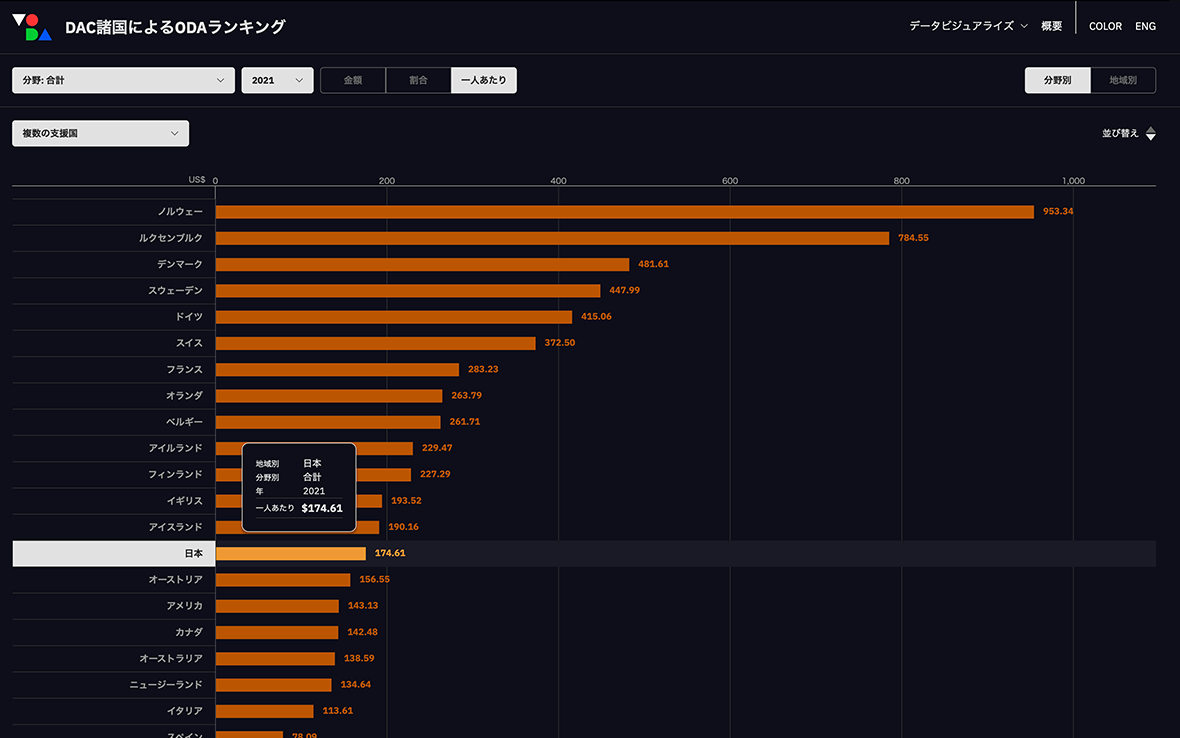
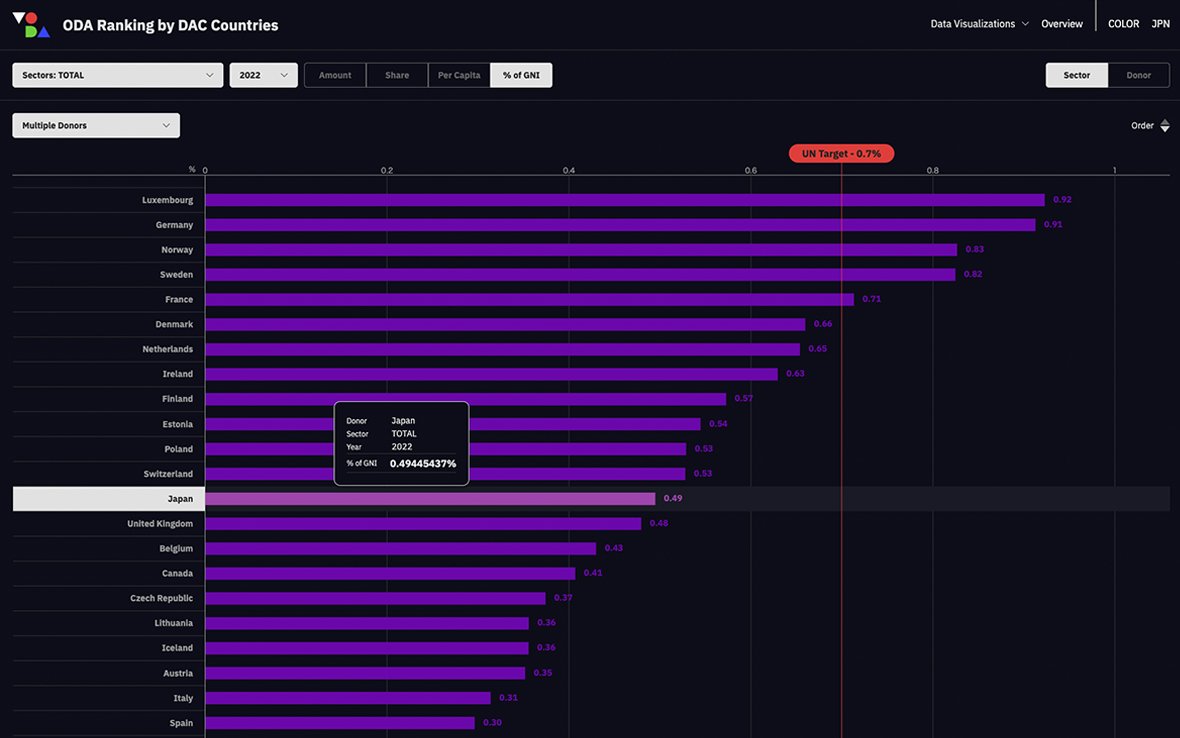
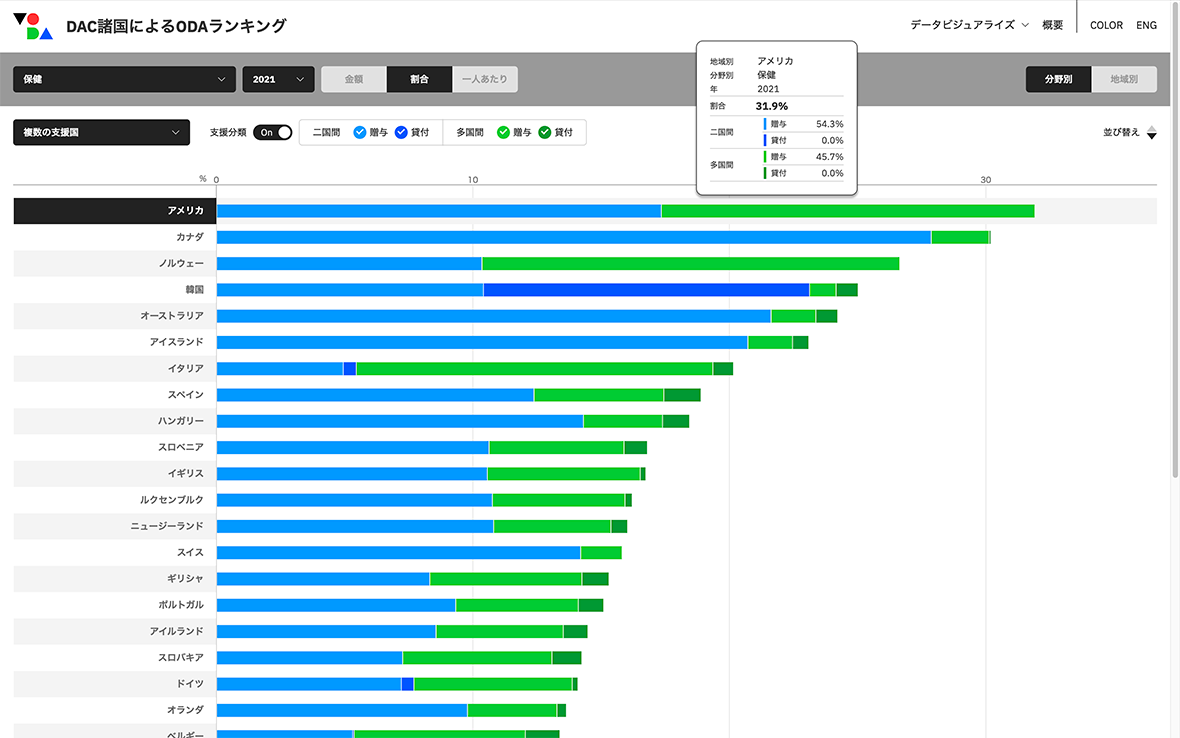
RANKING ODA Ranking by DAC Countries https://visualizingoda.org/ranking
This interactive chart visualizes the rankings of the amounts and shares of ODA by donor countries in each of the 22 aid sectors, and further visualizes the rankings of the ODA amounts and shares by sectors in each of the donor countries. Additionally, the chart shows the per capita ODA amounts and their proportion to the Gross National Income (GNI) of the donor countries. Switching between the donor country rankings and the sector rankings can be done using the tabs at the top right of the screen. Donor countries are listed in alphabetical order.
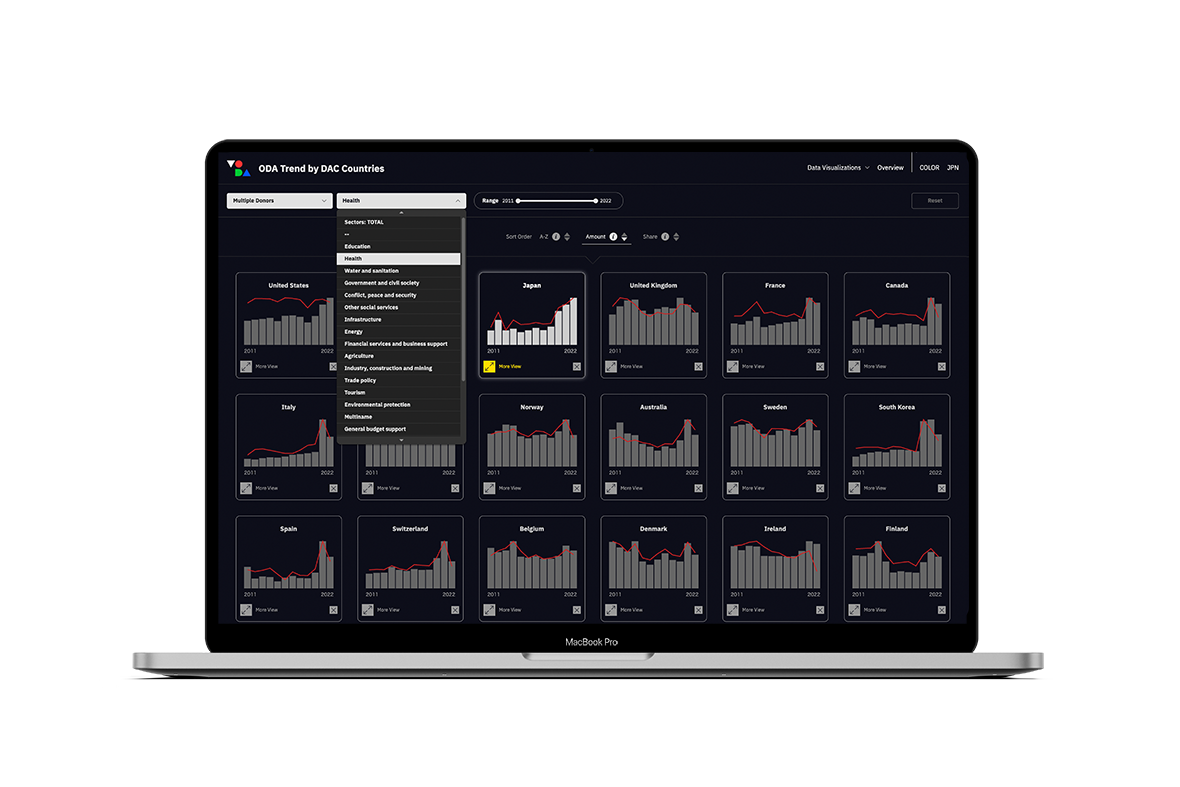
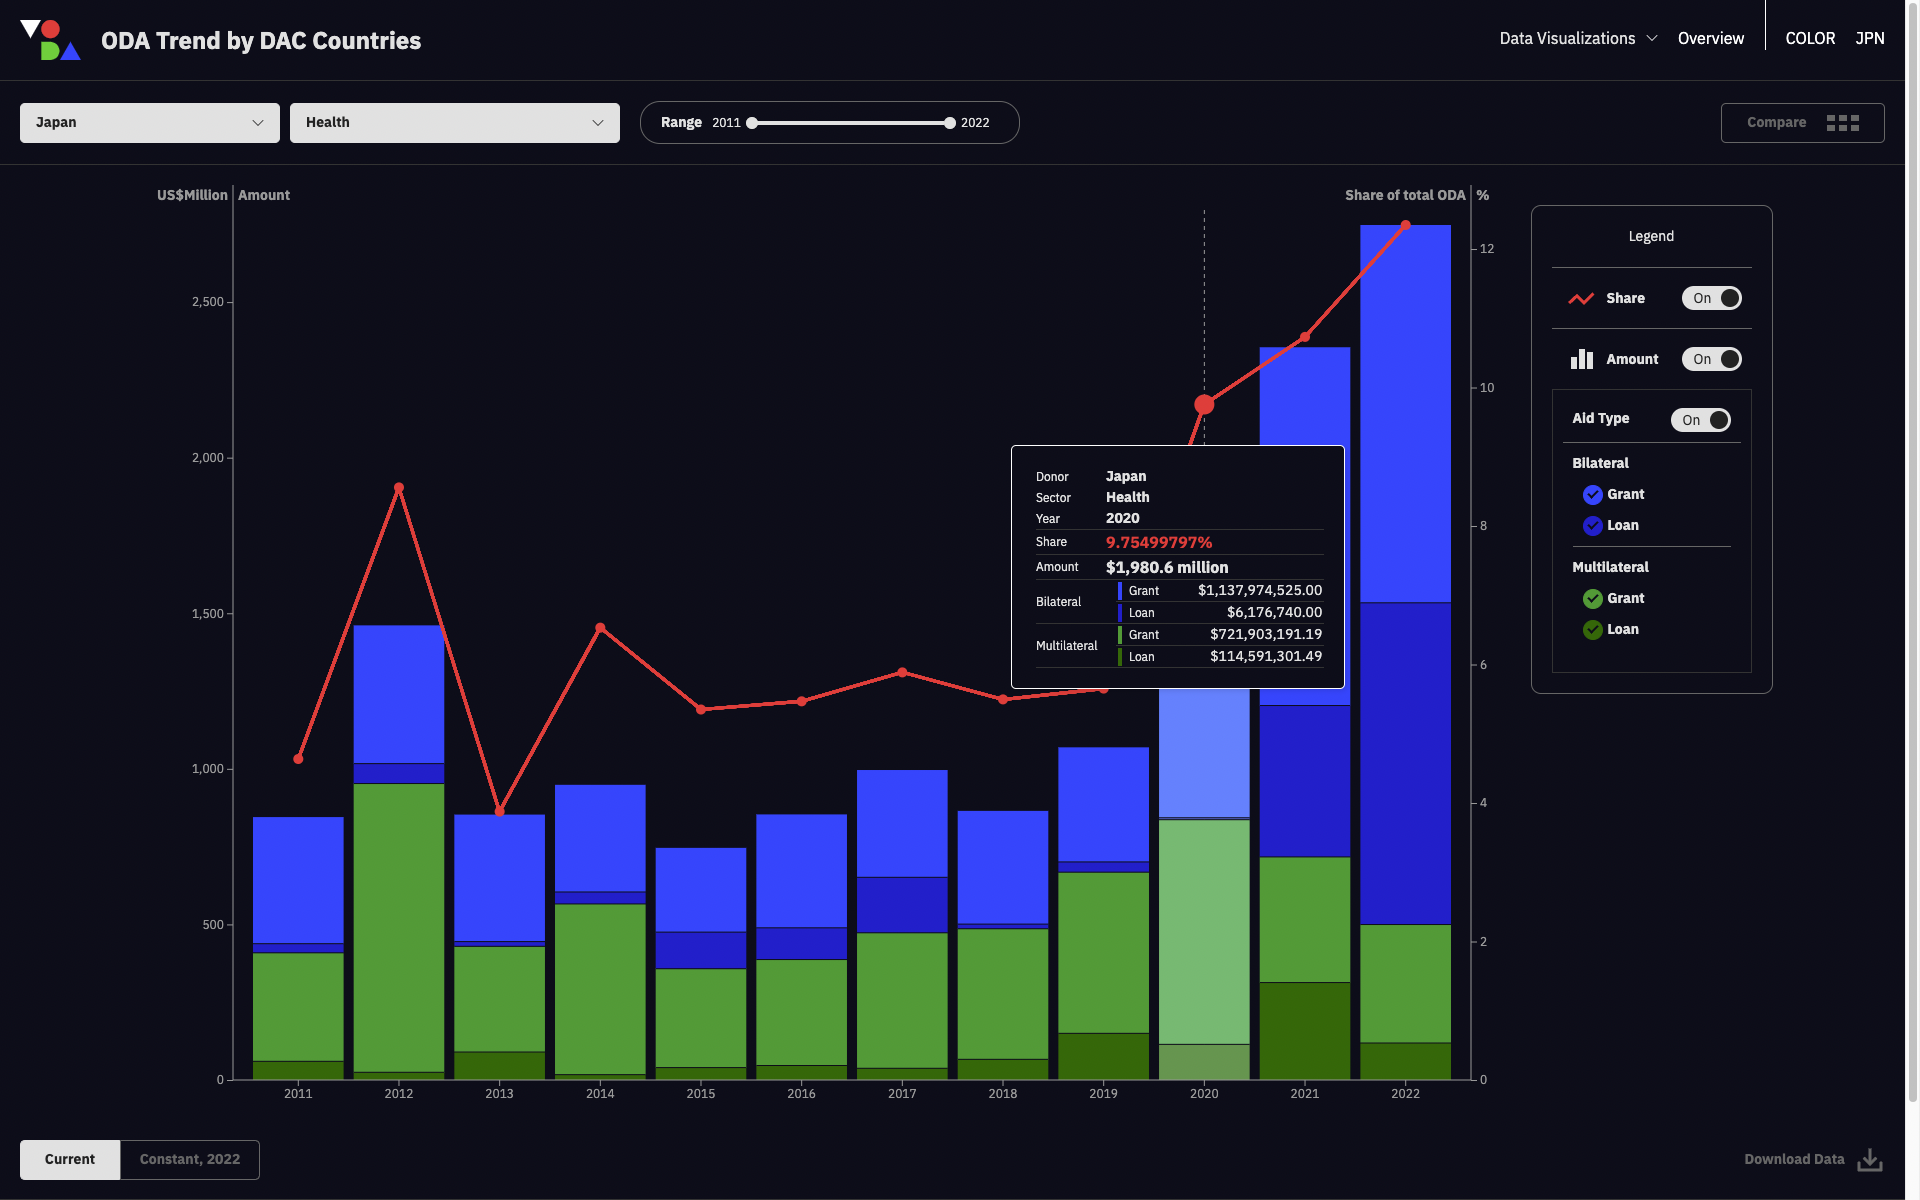
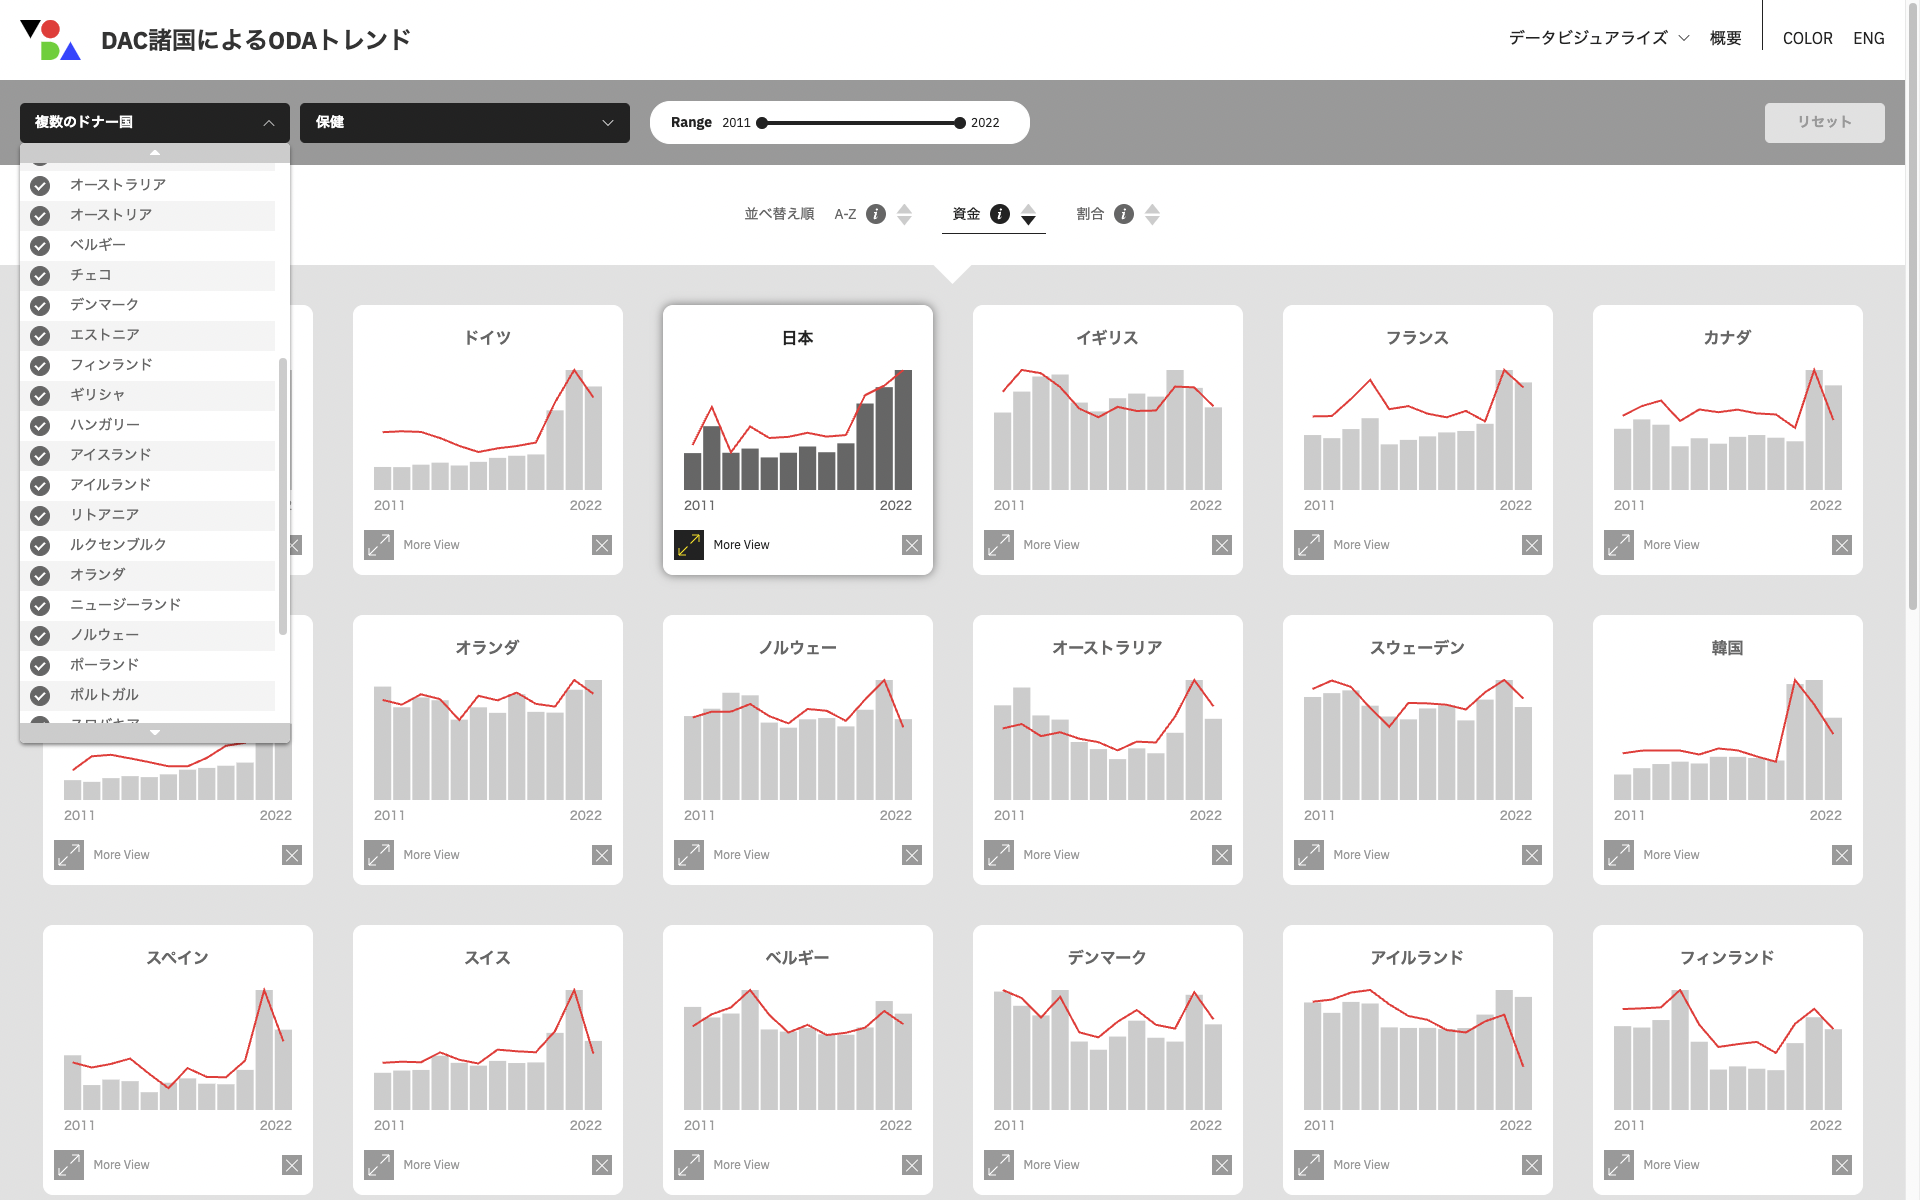
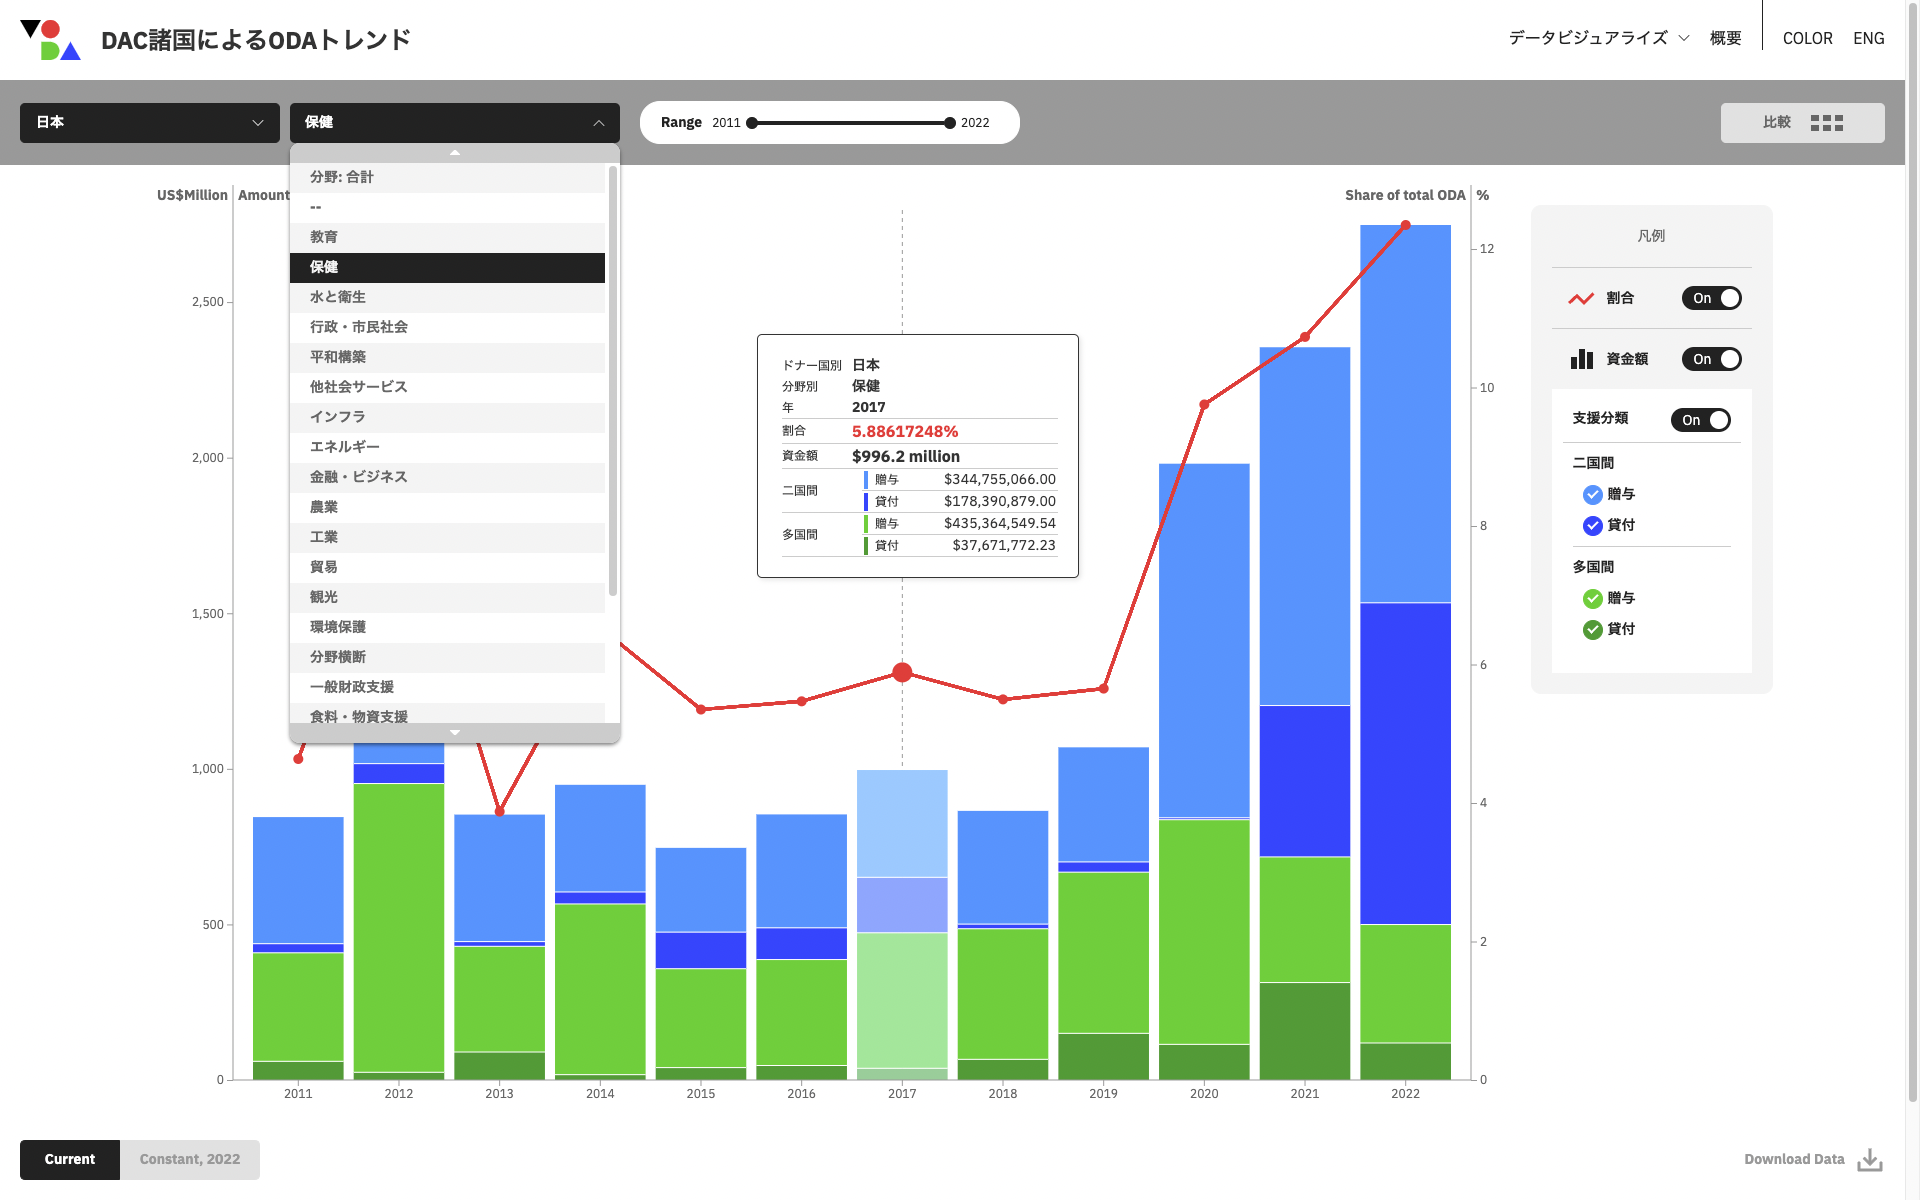
TREND ODA Trend by DAC Countries https://visualizingoda.org/trend
This interactive chart shows how ODA disbursements across different aid sectors have changed over time for each donor country since 2011. It visualizes the temporal changes in ODA amounts and shares across the 22 aid sectors.Donor countries are listed in alphabetical order, and each country’s data can be viewed by selecting from the dropdown menu.
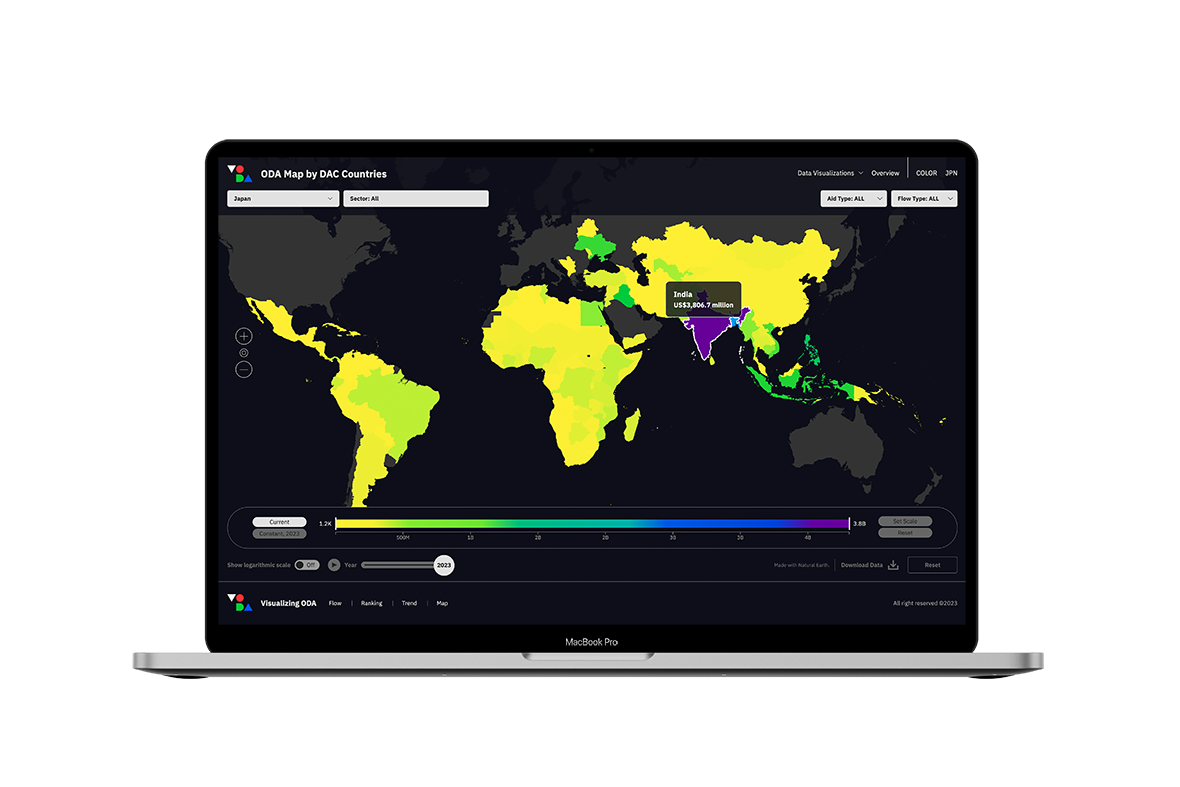
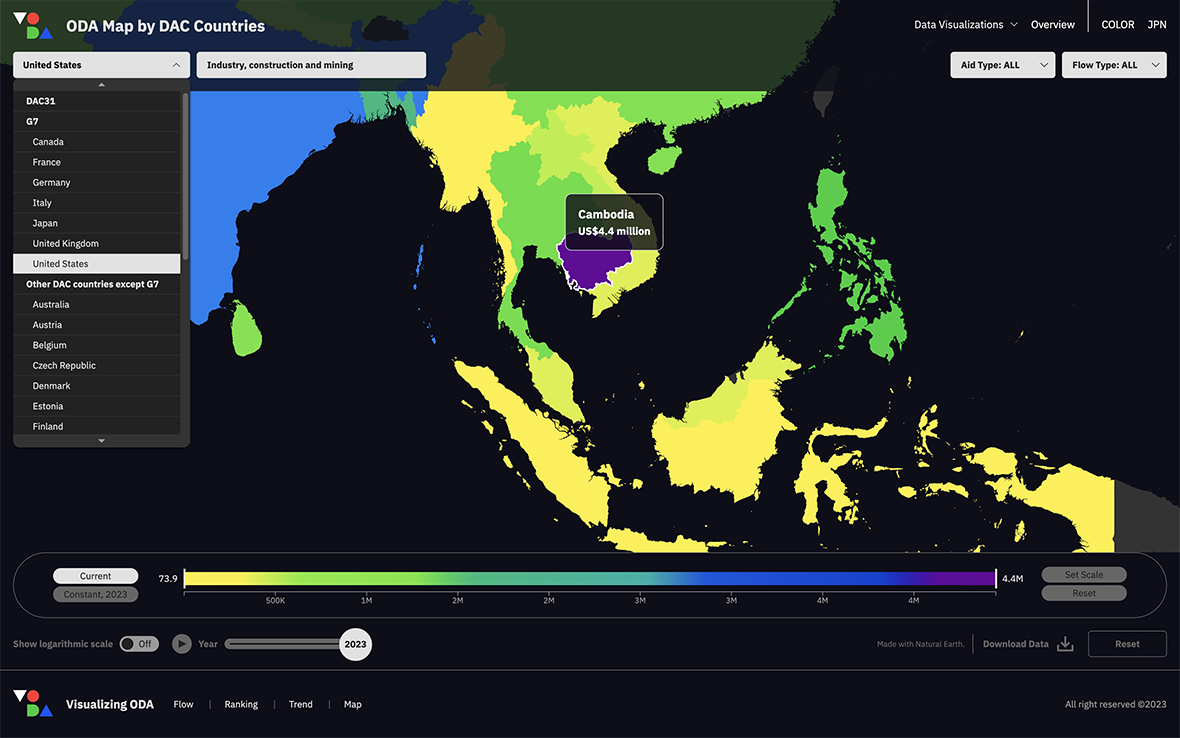
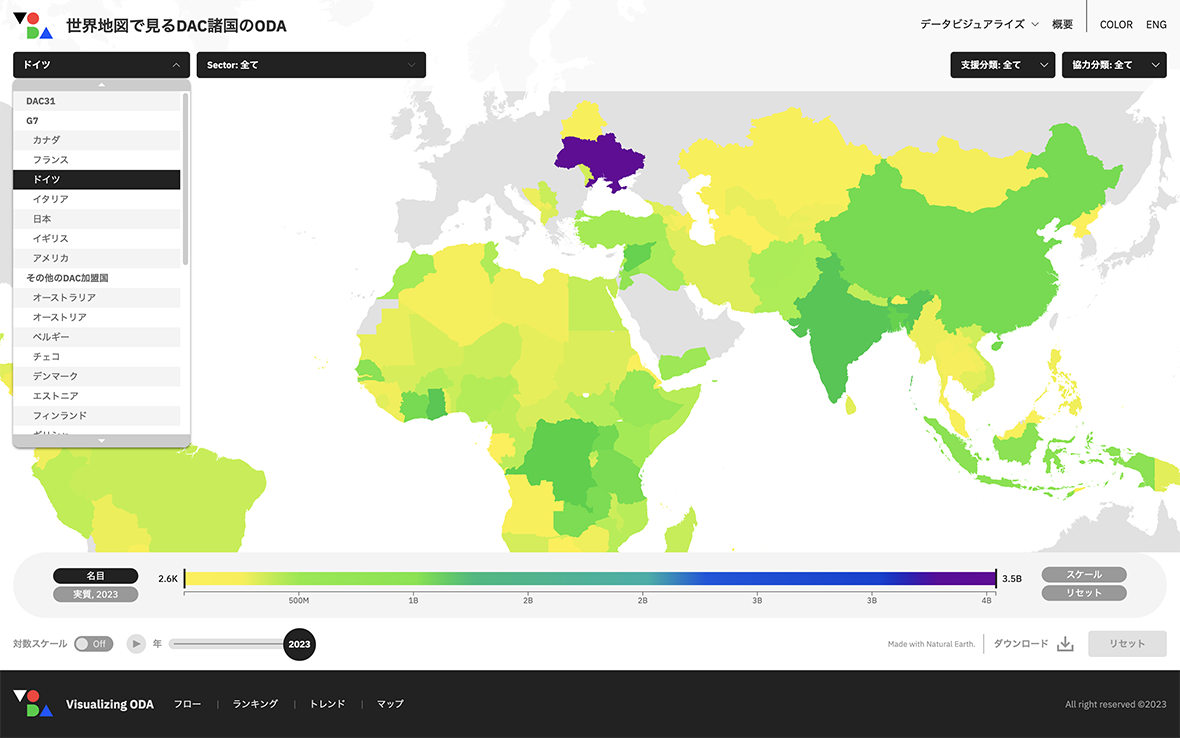
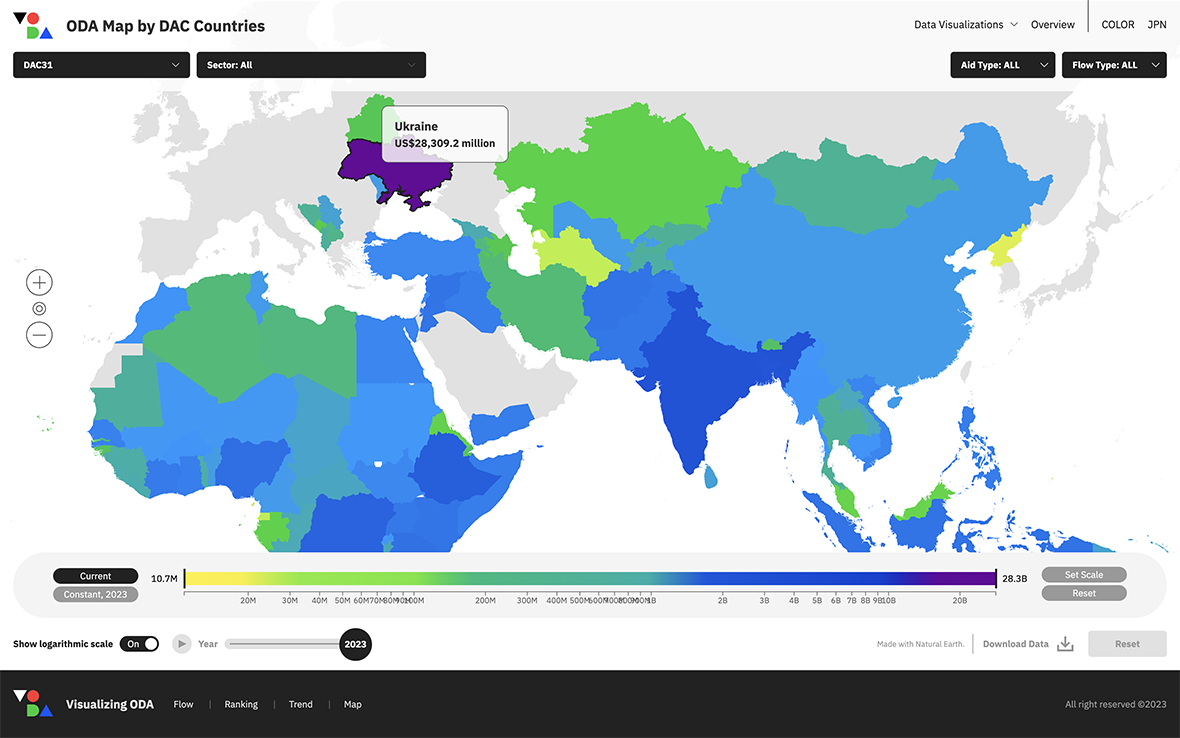
MAP ODA MAP by DAC Countries https://visualizingoda.org/map
This interactive chart shows the distribution of ODA disbursements across 22 aid sectors to recipient countries since 2011 on a world map for each donor country. Please note that ODA for projects implemented on a regional basis, rather than targeting a specific country, is not displayed. Donor countries are listed alphabetically and can be selected from a dropdown menu.